GPU Computing
Overview
Request a GPU in Slurm with
--qos=gpu,--partition=GPU_TYPE, and--gres=gpu:1.Monitor GPU performance using
nvidia-smiin the background.If you are uncertain about how to proceed, contact the IT Services’ Research and Innovation team at an early stage.
GPU nodes enable massively parallel tasks, ideal for scientific workloads.
Note
Host (CPU) memory is the normal system RAM you request with --mem (Slurm can kill your job if you exceed it).
Device (GPU) memory is the memory on the GPU itself (errors often mention CUDA and “out of memory”).
What are GPUs and how do they parallelise calculations?
GPUs (Graphics Processing Units) were originally designed to accelerate graphics processing, performing simple calculations in parallel across millions of pixels. Modern GPUs, sometimes called GP-GPUs (General Purpose GPUs), have evolved to handle general-purpose numerical calculations, making them invaluable for parallel computing in scientific research.
GPUs excel at matrix and vector operations, which are common in fields like deep learning. They can significantly outperform CPUs on problems that can be efficiently parallelised.
To run part of a program on a GPU, you typically need to:
Write a kernel - the GPU-accelerated part of your code-compiled for the GPU architecture.
Transfer data from host (CPU) memory (RAM) to device (GPU) memory (VRAM).
Launch the kernel on the GPU.
Transfer results back from device (GPU) memory to host (CPU) memory.
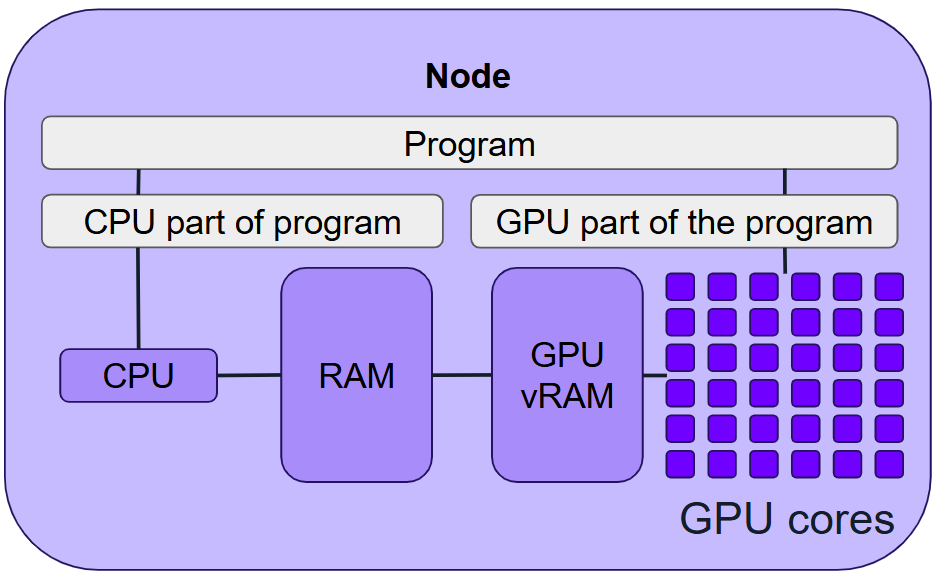
Frameworks like the CUDA toolkit (for NVIDIA GPUs) help manage these tasks.
On Stanage, we have a range of NVIDIA GPUs. These are not desktop GPUs - they are research-grade cards with large memory, high bandwidth, and specialised instructions for scientific workloads.
Access to GPU resources
Public GPU nodes are available on Stanage and do not require special permissions.
Research groups can also purchase additional GPU resources or priority access. To use these resources, researchers need approval from the academic or principal investigator who made the purchase.
Cluster-specific guidance:
Reserving GPUs in Slurm
GPUs are requested in Slurm as generic trackable resource (GRES). For most jobs:
--qos=gpu --partition=gpu --gres=gpu:1
Available GPU resources
To see available GPU resources:
sinfo -p gpu,gpu-h100,gpu-h100-nvl -O NodeList,NodeAIOT,Gres,GresUsed
The columns of NODES(A/I/O/T) are the number of nodes that are currently allocated, idle (free for jobs), other states (e.g., down, draining, reserved), and total. The GRES column shows the number of GPUs available for each node in that row. The GRES_USED column shows the number of GPUs currently in use on the nodes on that row. For example, gpu:a100:4(IDX:0-3) shows that four A100 GPUs are in use in each node and hence none are available for new jobs, whilst gpu:h100:0(IDX:N/A) shows that zero H100 GPUs are in use, and hence two are available for new jobs on each node shown on that row.
Requesting multiple GPUs
You can request multiple GPUs (per node) with:
--qos=gpu --partition=gpu --gres=gpu:G
Where G is the number of GPUs per node. Make sure that G does not exceed the number
of GPUs available on a single node in that partition — otherwise, your job will never start.
Note
Many programs don’t automatically scale to multiple GPUs. Ensure your application supports multi-GPU use before requesting more than one.
Specifying a GPU Type
On Stanage there are A100, H100, and H100 NVL GPUs.
On Stanage you can request an A100 with --partition=gpu, an H100 with --partition=gpu-h100, or an H100 NVL with --partition=gpu-h100-nvl.
Example: running a GPU-enabled program
Note
The necessary scripts for the upcoming exercises are located in our hpc-examples repository. This repository is accessible on our Stanage HPC cluster. To utilise it, load the module:
module load hpc-examples
After loading, you can access the examples scripts via the $HPC_EXAMPLES environment variable.
For example, you can then run slurm/pi.py in the following way:
python $HPC_EXAMPLES/slurm/pi.py
The example ${HPC_EXAMPLES}/slurm/pi-gpu.cu estimates π using Monte Carlo methods with GPU acceleration.
First, start a short interactive GPU session on Stanage:
srun --partition=gpu --qos=gpu --gres=gpu:1 --cpus-per-task=16 --time=00:10:00 --pty bash
Load the required modules:
module load hpc-examples
module load GCC/12.3.0
module load CUDA/12.4.0
Compile the CUDA program for multiple GPU architectures:
nvcc -gencode=arch=compute_80,code=sm_80 \
     -gencode=arch=compute_90,code=sm_90 \
     -gencode=arch=compute_90,code=compute_90 \  # PTX fallback
     -o pi-gpu ${HPC_EXAMPLES}/slurm/pi-gpu.cu
Note
Each example includes a line of the form: -gencode=arch=compute_XX,code=compute_XX
This embeds PTX (Parallel Thread Execution) for the target GPU architecture.
While not required, it is good practice: the PTX allows your binary to run on
future GPUs that support the same compute capability, even if they don’t exactly match
any compiled sm_XX binary. The driver can just-in-time compile from PTX if needed.
After compiling, type exit to return to a login node.
Run the program interactively (this is the preferred method for small tests, as it frees up valuable resources immediately upon completion):
srun --partition=gpu --qos=gpu --gres=gpu:1 --time=00:10:00 --mem=500M ./pi-gpu 1000000
Note
For real GPU workloads, we normally recommend requesting slightly more host (CPU) memory than the GPU device memory
(and enough CPUs to support data loading / preprocessing).
This is a tiny example, so --mem=500M and the default CPU allocation are sufficient here.
See Choosing appropriate GPU compute resources for Stanage’s recommended per-GPU CPU and host memory guidelines.
Alternatively, use a Slurm script (even for small tests, it’s useful when the system is busy):
#!/bin/bash
#SBATCH --time=00:10:00
#SBATCH --partition=gpu
#SBATCH --qos=gpu
#SBATCH --gres=gpu:1
#SBATCH --mem=500M
#SBATCH --output=pi-gpu.out

module load GCC/12.3.0
module load CUDA/12.4.0
./pi-gpu 1000000
Error
If you see errors about missing CUDA libraries, check the Missing CUDA libraries section.
Monitoring GPU usage
You can monitor GPU usage during a job by running the nvidia-smi command in the background as part of your Slurm script, before launching your program:
nvidia-smi --query-gpu=index,timestamp,utilization.gpu,memory.total,memory.used,memory.free --format=csv -l 2 > gpu_stats_${SLURM_JOB_ID}.log &
./your_program
This will generate a log file gpu_stats_${SLURM_JOB_ID}.log containing GPU utilisation and memory usage data every two seconds.
To view the first few entries of the log file we can use the head command:
$ head -5 gpu_stats_681564.log
index, timestamp, utilization.gpu [%], memory.total [MiB], memory.used [MiB], memory.free [MiB]
0, 2025/05/08 13:04:32.895, 0 %, 81920 MiB, 1 MiB, 81038 MiB
0, 2025/05/08 13:04:34.905, 0 %, 81920 MiB, 1 MiB, 81038 MiB
0, 2025/05/08 13:04:36.905, 0 %, 81920 MiB, 1 MiB, 81038 MiB
0, 2025/05/08 13:04:38.906, 0 %, 81920 MiB, 1 MiB, 81038 MiB
Tip
For live monitoring, you can use: tail -f gpu_stats_JOBID.log
This feedback is useful for confirming that your program is utilising the GPU resources as expected. If GPU utilisation or memory usage appears suspiciously low, it may be a sign that your GPU code isn’t running effectively — or at all.
If GPU utilisation is low you should check CPU utilistion after the job has finished with seff.
The seff script can be used as follows with the job’s ID to give summary of important job info :
$ seff job-id
For example, on the Stanage cluster:
$ seff 64626
Job ID: 64626
Cluster: stanage.alces.network
User/Group: a_user/clusterusers
State: COMPLETED (exit code 0)
Nodes: 2
Cores per node: 1
CPU Utilized: 00:02:37
CPU Efficiency: 35.68% of 00:07:20 core-walltime
Job Wall-clock time: 00:03:40
Memory Utilized: 137.64 MB (estimated maximum)
Memory Efficiency: 1.71% of 7.84 GB (3.92 GB/core)
You can also monitor individual job steps by calling seff with the syntax seff job-id.job-step.
If your CPU usage is consistently low, your code may not be making effective use of the available resources — this could be due to inefficient code or a lack of parallelisation.
If memory usage is far below or above the requested amount, consider adjusting your allocation. It’s generally best to request slightly more RAM than your code typically uses, to avoid job failures while minimising waste.
These commands report on CPU and memory usage (but not GPU details as GPU stats are not available in seff on our clusters).
If you see high CPU usage but low GPU utilisation, it may indicate that the CPUs are struggling to keep the GPU fed with data.
In this case, consider requesting more CPUs (e.g. using --cpus-per-task=8 or higher) — provided your application can actually use them effectively, such as multi-threaded data loading.
Be mindful not to request more CPUs than needed, as this can lead to resource waste and reduced availability for other users.
Typical example:
#!/bin/bash
#SBATCH --time=02:00:00
#SBATCH --partition=gpu
#SBATCH --qos=gpu
#SBATCH --gres=gpu:1
#SBATCH --nodes=1
#SBATCH --ntasks=1
#SBATCH --cpus-per-task=8
#SBATCH --mem=82G
#SBATCH --output=output.%j.out

module load GCC/12.3.0
module load CUDA/12.4.0
./your_program
If you’re unsure about how to strike the right balance between CPU and GPU usage, don’t hesitate to contact the IT Services’ Research and Innovation team for advice. We’re here to help you get the best performance out of your code!
Common issues and special cases
Out of memory (host vs GPU device)
If your job fails with host (CPU) OOM, Slurm may terminate it - in that case, increasing --mem may help.
If it fails with GPU device OOM (often shown as CUDA “out of memory”), requesting more host memory will not fix it. You’ll need to reduce the workload (e.g. batch size / model size) or use a GPU with more device memory.
Missing CUDA libraries
If you see:
libcuda.so.1: cannot open shared object file: No such file or directory
you’re trying to run a GPU program on a non-GPU node (e.g. a login node).
Sometimes this happens because your job is missing the correct CUDA modules.
Always ensure the same modules are loaded at runtime as during compilation.
CUDA and Python deep learning frameworks
Python frameworks like TensorFlow and PyTorch require compatible CUDA toolkits. We recommend using:
Your own Conda environment as described in Python.
Our pre-installed modules (see Software on Stanage).
Our recipes for installing TensorFlow and PyTorch on Stanage.
Setting CUDA architecture flags
When compiling CUDA programs, use architecture flags that match available GPUs:
-gencode=arch=compute_80,code=sm_80 \
-gencode=arch=compute_90,code=sm_90 \
-gencode=arch=compute_90,code=compute_90  # PTX fallback
These flags together target the A100 and H100 cards.
Tip
Reminder: code=compute_XX embeds PTX for future-proofing your binary.
For further detail, see:
Maximising GPU utilisation: data-loading tips
Efficient data loading is crucial to avoid underutilising your GPU:
Store data in large files.
Use multiple CPU threads for loading/preprocessing.
Batch data for the GPU.
For data that is too large to fit in /dev/shm or $TMPDIR, please contact us
for tailored solutions for efficiently handling large datasets.
Framework-specific advice:
Profiling GPU usage
Profiling tools can help you spot bottlenecks and optimise GPU workloads:
NVIDIA Nsight Systems and Nsight Compute: Visualise GPU performance and track kernel execution. (Note: Nsight Compute is not currently usable on Stanage)
PyTorch Profiler: Integrated profiling for PyTorch workflows.
For usage, see CUDA on Stanage, Pytorch profiler documentation and tutorials .
See also
Exercises
GPU Exercise 1: Running the example
Run the π estimation example with a larger trial count (1000000000000 or \(10^{12}\)).
Try both interactive and Slurm script-based submissions.
GPU Exercise 2: Use nvidia-smi
Use srun to run nvidia-smi on a GPU node. For guidance, see the section Accessing a Running Single-Node Slurm Batch job.
GPU Exercise 3: Log GPU utilisation with nvidia-smi
Insert the following line into the previous Slurm batch script to log GPU utilisation.
nvidia-smi --query-gpu=index,timestamp,utilization.gpu,memory.total,memory.used,memory.free --format=csv -l 1 > gpu_stats_${SLURM_JOB_ID}.log &
For this short test, logging every second is appropriate.
Also use ${HPC_TOOLS}/analyse_gpu_log.sh to find maximum and average values. Try adding this to your batch script.
GPU Exercise 4: Profile with Nsight Systems nsys
Run the program with NVIDIA’s nsys profiler to collect performance statistics:
nsys profile --stats true -o my_report ./pi-gpu 1000000000000 2> my_report.err
GPU Exercise 5: Is Your Code GPU-Capable?
Think about whether your application is designed to exploit GPU acceleration. Does it use:
CUDA, ROCm, OpenCL, OpenMP offload, or OpenACC?
Libraries with GPU backends (e.g. cuBLAS, cuDNN, TensorFlow, PyTorch)?
What’s next?
You’ve seen the essentials of GPU computing - now it’s time to combine them with your own software, Linux skills, and Slurm knowledge. If you’re stuck or unsure how to scale up, don’t hesitate to ask for help! Contact the IT Services’ Research and Innovation team early so we can help you get the best out of your time.
This material contains material adapted from Aalto Scientific Computing Documentation, licensed under CC BY 4.0 Changes were made to the original content.