Shared Memory Parallelism
Shared Memory Parallelism: Multithreading & Multiprocessing
Overview
Confirm your code is capable of using multiple CPUs.
Reserve CPUs using
--cpus-per-task=NwhereNis the number of ‘cores per task’ that you need.Ensure your code uses the same number of CPUs you’ve requested. The
$SLURM_CPUS_PER_TASKenvironment variable provides this value.Always monitor your job (e.g.,
seff JOBID) to confirm it’s using resources as expected.If you are uncertain about scaling up, contact the IT Services’ Research and Innovation team at an early stage.
Shared-memory parallelism enables your code to scale within a single node.
What is Shared Memory Parallelism?
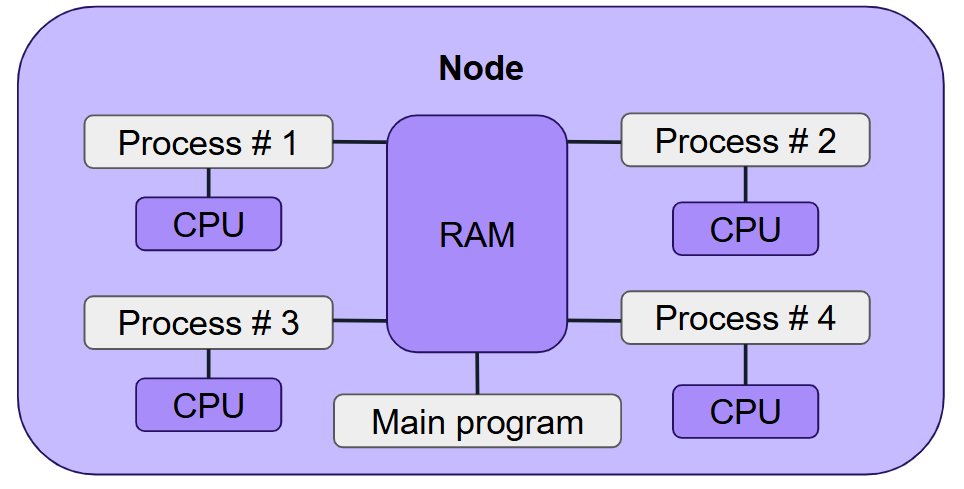
Shared memory parallelism allows a program to run multiple processes or threads that share access to the same memory space on one machine.
The Slurm setup for multithreading and multiprocessing is largely the same. We mainly refer to processes here, but the same applies to threads. See the section on threads versus processes for details.
Communication between threads or processes is achieved through shared memory, so all of them must run on the same node.
Examples include:
Matlab’s parallel pool (processes)
R’s
parallelpackage (processes)Python’s
multiprocessing(processes)NumPy/BLAS/OpenMP (threads)
Special Considerations
Monitoring CPU Usage
The seff script can be used as follows with the job’s ID to give summary of important job info :
$ seff job-id
For example, on the Stanage cluster:
$ seff 64626
Job ID: 64626
Cluster: stanage.alces.network
User/Group: a_user/clusterusers
State: COMPLETED (exit code 0)
Nodes: 2
Cores per node: 1
CPU Utilized: 00:02:37
CPU Efficiency: 35.68% of 00:07:20 core-walltime
Job Wall-clock time: 00:03:40
Memory Utilized: 137.64 MB (estimated maximum)
Memory Efficiency: 1.71% of 7.84 GB (3.92 GB/core)
You can also monitor individual job steps by calling seff with the syntax seff job-id.job-step.
If your CPU usage is consistently low, your code may not be making effective use of the available resources — this could be due to inefficient code or a lack of parallelisation.
If memory usage is far below or above the requested amount, consider adjusting your allocation. It’s generally best to request slightly more RAM than your code typically uses, to avoid job failures while minimising waste.
Threads vs Processes & Double Booking
Processes are independent tasks (
--ntasks) with separate memory.Cores (threads,
--cpus-per-task) share memory within a process and are generally lighter but can interfere with each other.
Many programs use both. For example, R may use processes via parallel and threads via OpenMP.
Avoid mixing the two unintentionally, e.g., running 4 processes that each launch 4 threads can lead to 16 concurrent tasks—oversubscribing CPUs and harming performance.
To avoid this:
export OMP_NUM_THREADS=1
CPU Mismatch
Launching more threads or processes than CPUs requested leads to oversubscription, which usually causes poor performance due to excessive context switching and resource contention. Launching fewer underutilises the node and wastes your allocation.
On our clusters, Hyperthreading is disabled — each Slurm CPU corresponds to one physical core. This means:
You cannot “squeeze in” extra threads per CPU.
Matching your thread or process count exactly to
--cpus-per-task=Nis essential.Oversubscribing CPUs can degrade performance, even if total CPU usage appears high.
To avoid mismatches:
Set the number of threads or processes in your code to match
--cpus-per-task.Use the environment variable
SLURM_CPUS_PER_TASKto configure this dynamically.
▶ Click to expand: See a full worked example - Effect of oversubscription and underutilisation
Here’s a simple script thread_test.py which simulates CPU work:
import time
import os
from multiprocessing import Pool

def work(_):
    s = 0
    for _ in range(10**10):  # Simulate CPU-heavy computation
        s += 1
    return s

n_workers = int(os.getenv("OMP_NUM_THREADS", 1))  # Match this to --cpus-per-task
n_jobs = n_workers * 4  # Ensure enough work to occupy all workers

print(f"Using {n_workers} worker processes on {n_jobs} jobs")

start = time.time()
with Pool(processes=n_workers) as pool:
    pool.map(work, range(n_jobs))
end = time.time()

print(f"Elapsed time: {end - start:.2f}s")
We submit this script using a Slurm task array for 1, 2, 4 and 8 processes:
#!/bin/bash
#SBATCH --job-name=threads_test
#SBATCH --array=1,2,4,8
#SBATCH --time=00:15:00
#SBATCH --cpus-per-task=4
#SBATCH --mem=1G
#SBATCH --output=slurm-%A_%a.out

module load Python/3.11.3-GCCcore-12.3.0

export OMP_NUM_THREADS=${SLURM_ARRAY_TASK_ID}
python thread_test.py
Using seff JOBID_ARRAYID, we observe:
Procs |
Jobs |
Wall Time |
CPU Time |
CPU Efficiency (%) |
Notes |
|---|---|---|---|---|---|
1 |
4 |
24:29 |
24:28 |
25.0 |
Only 1 core used (3 idle) |
2 |
8 |
24:09 |
48:10 |
49.9 |
2 cores fully utilised |
4 |
16 |
24:25 |
97:31 |
99.9 |
4 cores fully utilised - optimal |
8 |
32 |
50:29 |
196:20 |
97.2 |
8 procs on 4 cores - context switching |
We increased the total workload in proportion to the number of Python processes, keeping --cpus-per-task=4 constant. The key observations are:
From 1 to 4 processes, wall time remained roughly constant while CPU time increased. This indicates better utilisation of the allocated 4 cores as more processes were launched.
At 4 processes, each core had one process — resulting in full utilisation and near-100% CPU efficiency.
At 8 processes, the workload doubled and wall time also doubled — demonstrating correct scaling of total work.
However, CPU efficiency dropped slightly (from 99.9% to 97.2%) due to process-level oversubscription: more processes than available cores introduced overhead from context switching.
Key insight:
Always match the number of threads or processes to your --cpus-per-task.
Even small mismatches can introduce inefficiencies, despite high overall CPU usage.
Using SLURM_CPUS_PER_TASK Effectively
Set a default in your code to enable running on own machine and cluster:
# As an example
export NCORES=${SLURM_CPUS_PER_TASK:-4}
In Python:
import os
n_cores = int(os.getenv("SLURM_CPUS_PER_TASK", 1))
In R:
n_cores <- as.integer(Sys.getenv("SLURM_CPUS_PER_TASK", unset=1))
In MATLAB:
% MATLAB lacks a built-in defaulting mechanism
val = getenv("SLURM_CPUS_PER_TASK");
if isempty(val)
   n_cores = 4;
else
   n_cores = str2double(val);
end
Asking for Multiple Tasks
Avoid using --ntasks=n unless your code uses MPI. Using both --ntasks and --cpus-per-task incorrectly may start multiple copies of your program, all competing for the same CPUs.
Only use both in hybrid parallel jobs.
Exercises
Note
The necessary scripts for the upcoming exercises are located in our hpc-examples repository. This repository is accessible on our Stanage HPC cluster. To utilise it, load the module:
module load hpc-examples
After loading, you can access the examples scripts via the $HPC_EXAMPLES environment variable.
For example, you can then run slurm/pi.py in the following way:
python $HPC_EXAMPLES/slurm/pi.py
This section explores shared-memory parallelism using practical Python examples. You’ll experiment with CPU scaling, identify performance bottlenecks, and assess the impact of code optimisation.
Scale the ngrams example using 1–8 CPUs to find the sweet spot for performance vs efficiency.
Run and scale
pi.pyusing 1, 2, and 4 CPUs. Compare wall time and CPU utilisation usingseff JOBID.Use
--serial=0.1,--serial=0.5, etc., to simulate partial serial workloads.Try
--optimizedto explore the performance benefits of vectorised NumPy code.Reflect on whether your own software could benefit from shared-memory parallelism. Look for hints like
nprocs,nworkers, orOpenMPusage.
Shared memory parallelism 1: Scaling the ngrams example
Investigate how the ngrams code scales with increasing numbers of cores. How many should you use for best efficiency? (The steps are a bit involved, so following the worked solution is recommended.)
For consistent results, use the -n 2 –words flag. (Note: on systems with multiple architectures you need to constrain to a specific architecture for results to be comparable, e.g. --constraint=intel )
Solution
First, we’ll compare performance using character ngrams. Output is discarded so disk writing time doesn’t affect results. (On other systems all runs can be constrained to identical hardware for fairness):
## 100 books
srun -c 1 python3 ${HPC_EXAMPLES}/ngrams/count.py -n 2 ${HPC_EX_DATA}/Gutenberg-Fiction-first100.zip -o /dev/null
srun -c 1 python3 ${HPC_EXAMPLES}/ngrams/count-multi.py -n 2 -t auto ${HPC_EX_DATA}/Gutenberg-Fiction-first100.zip -o /dev/null
srun -c 2 python3 ${HPC_EXAMPLES}/ngrams/count-multi.py -n 2 -t auto ${HPC_EX_DATA}/Gutenberg-Fiction-first100.zip -o /dev/null
srun -c 4 python3 ${HPC_EXAMPLES}/ngrams/count-multi.py -n 2 -t auto ${HPC_EX_DATA}/Gutenberg-Fiction-first100.zip -o /dev/null
srun -c 8 python3 ${HPC_EXAMPLES}/ngrams/count-multi.py -n 2 -t auto ${HPC_EX_DATA}/Gutenberg-Fiction-first100.zip -o /dev/null
Performance summary for character ngrams:
Cores |
Time (s) |
Speedup |
Total Core Time (s) |
CPU Efficiency (%) |
|---|---|---|---|---|
Single-core code |
26.26 |
26.26 |
100.00 |
|
1 |
26.17 |
1.003 |
26.17 |
96.30 |
2 |
14.55 |
1.805 |
29.10 |
86.67 |
4 |
8.75 |
3.001 |
35.00 |
75.00 |
8 |
5.96 |
4.406 |
47.68 |
56.25 |
Using up to 4 cores yields a good speedup without excessive resource cost.
Next, compare the same for word-based ngrams. These generate more data, so performance scaling is worse:
## 1000 books
srun  --mem=10G -c 1 python3 ${HPC_EXAMPLES}/ngrams/count.py -n 2 --words ${HPC_EX_DATA}/Gutenberg-Fiction-first1000.zip -o /dev/null
srun  --mem=10G -c 1 python3 ${HPC_EXAMPLES}/ngrams/count-multi.py -n 2 --words -t auto ${HPC_EX_DATA}/Gutenberg-Fiction-first1000.zip -o /dev/null
srun  --mem=10G -c 2 python3 ${HPC_EXAMPLES}/ngrams/count-multi.py -n 2 --words -t auto ${HPC_EX_DATA}/Gutenberg-Fiction-first1000.zip -o /dev/null
srun  --mem=10G -c 4 python3 ${HPC_EXAMPLES}/ngrams/count-multi.py -n 2 --words -t auto ${HPC_EX_DATA}/Gutenberg-Fiction-first1000.zip -o /dev/null
srun  --mem=10G -c 8 python3 ${HPC_EXAMPLES}/ngrams/count-multi.py -n 2 --words -t auto ${HPC_EX_DATA}/Gutenberg-Fiction-first1000.zip -o /dev/null
Results:
Example output:
$ srun  --mem=10G -c 8 python3 ${HPC_EXAMPLES}/ngrams/count-multi.py -n 2 --words -t auto ${HPC_EX_DATA}/Gutenberg-Fiction-first100.zip -o /dev/null
srun: job 6570918 queued and waiting for resources
srun: job 6570918 has been allocated resources
Found 100 files in /path/to/Gutenberg-Fiction-first100.zip
Using multiprocessing.Pool with 8 processes
2-grams: 1866260

Walltime 13.67 s
User time: 25.05 s (12.10 + 12.95)
System time: 1.60 s (0.71 + 0.88)
MaxRSS: 1.235 GiB (0.937 + 0.297)
We can use seff JOBID to find the CPU efficiency:
$ seff 6570918
Job ID: 6570918
Cluster: stanage.alces.network
User/Group: te1st/clusterusers
State: COMPLETED (exit code 0)
Nodes: 1
Cores per node: 8
CPU Utilized: 00:00:27
CPU Efficiency: 24.11% of 00:01:52 core-walltime
Job Wall-clock time: 00:00:14
Memory Utilized: 0.00 MB (estimated maximum)
Memory Efficiency: 0.00% of 10.00 GB (10.00 GB/node)

Notice that seff reports 0 MB memory usage — this is because memory usage is sampled periodically (typically every 30 seconds),
and short jobs may not be captured. CPU time, however, is based on process accounting and is generally accurate,
aside from occasional rounding quirks.
Cores |
Time (s) |
Speedup |
Core Time Used (s) |
CPU Efficiency (%) |
|---|---|---|---|---|
Single-core code |
22.58 |
29.6 s |
100.00 |
|
1 |
26.61 |
0.849 |
29.6 s |
100.00 |
2 |
18.14 |
1.245 |
35.4 s |
71.05 |
4 |
14.46 |
1.562 |
57.6 s |
45.00 |
8 |
13.67 |
1.652 |
96.8 s |
24.11 |
Cores |
Time (s) |
Speedup |
Core Time Used (s) |
CPU Efficiency (%) |
|---|---|---|---|---|
Single-core code |
160.43 |
160.43 |
100.00 |
|
1 |
199.68 |
0.803 |
199.68 |
99.01 |
2 |
119.00 |
1.348 |
238.00 |
82.50 |
4 |
89.79 |
1.787 |
359.16 |
53.02 |
8 |
85.19 |
1.883 |
681.52 |
28.02 |
With word ngrams, even modest parallelism offers limited gains. Overheads from I/O and data transfer dominate. Using a Slurm array job to parallelise across input files and then aggregating results separately may be more effective.
Some key bottlenecks in the current code:
Reading files (especially within zip archives) is slow.
Writing plain text + JSON output is inefficient; binary formats would be faster.
Python’s
multiprocessinghas overhead when transferring large data between workers.
Shared memory parallelism 2: Scaling with different CPU counts
Run pi.py with 100,000,000 trials using 1, 2, and 4 CPUs. Record the wall-clock time and CPU usage reported by seff JOBID.
Solution
Start with a serial run:
srun --export=ALL --time=00:10:00 --mem=1G python3 ${HPC_EXAMPLES}/slurm/pi.py 100000000
Then test with 2 and 4 cores:
srun --export=ALL --cpus-per-task=2 --time=00:10:00 --mem=1G python3 ${HPC_EXAMPLES}/slurm/pi.py --nprocs=2 100000000
srun --export=ALL --cpus-per-task=4 --time=00:10:00 --mem=1G python3 ${HPC_EXAMPLES}/slurm/pi.py --nprocs=4 100000000
Use seff JOBID to compare wall time and CPU efficiency. Ideally, wall time should decrease proportionally to CPU count,
while total CPU time stays consistent.
Shared memory parallelism 3: Simulating partial serial workload
pi.py accepts a --serial flag to simulate a serial portion of the code. Run with 100,000,000 trials, 4 CPUs,
and different values of --serial: 0.1, 0.5, and 0.8.
Solution
Submit runs as follows:
srun --export=ALL --cpus-per-task=4 --time=00:10:00 --mem=1G python3 ${HPC_EXAMPLES}/slurm/pi.py --serial=0.1 --nprocs=4 100000000
srun --export=ALL --cpus-per-task=4 --time=00:10:00 --mem=1G python3 ${HPC_EXAMPLES}/slurm/pi.py --serial=0.5 --nprocs=4 100000000
srun --export=ALL --cpus-per-task=4 --time=00:10:00 --mem=1G python3 ${HPC_EXAMPLES}/slurm/pi.py --serial=0.8 --nprocs=4 100000000
Higher serial portions will reduce the benefit from parallelism. Use seff to observe diminishing speedup.
Shared memory parallelism 4: Comparing parallel vs optimised code
pi.py has an --optimized mode using NumPy for vectorised operations.
Run the normal version with 4 CPUs and the optimised version with 1 CPU. Compare runtime and utilisation.
Note: we’ll need to install numpy in a conda enviroment.
Solution
Create a conda environment:
module load Anaconda3
conda create -n numpy-env numpy -y
Run the parallel version:
srun --cpus-per-task=4 --time=00:10:00 --mem=1G bash -c "module load Anaconda3 hpc-examples && \
source activate numpy-env && python3 ${HPC_EXAMPLES}/slurm/pi.py --nprocs=4 100000000"
Then run the optimised version:
srun --time=00:10:00 --mem=1G bash -c "module load Anaconda3 hpc-examples && \
source activate numpy-env && python3 ${HPC_EXAMPLES}/slurm/pi.py --optimized 100000000"
NumPy’s vectorised implementation may outperform the multiprocess version even on fewer cores, due to efficient C/Fortran backends.
Shared memory parallelism 5: Assess your own code
Reflect on whether your own code supports shared-memory parallelism. Look for indications such as:
Command-line flags like nprocs, nworkers, num_threads, njobs
Mention of OpenMP or references to multi-threaded execution
Use of Python
multiprocessing, R’sparallelpackage, or similar constructs
Check documentation or seek help if uncertain.
What’s Next?
Proceed to the MPI parallelism guide.
This material contains material adapted from Aalto Scientific Computing Documentation, licensed under CC BY 4.0 Changes were made to the original content.